hpdz.net
High-Precision Deep Zoom
Still Images
The Henon Map
The Henon map one of my favorite fractals. In its simplest form, it has two parameters, both of which are complex numbers, and since complex numbers each have two components, there are actually four parameters that can be changed to give different images. That means four things to use for animations. What I've put here is only the tiniest hint of the complexity of this class of fractals.
This fractal is also called the Phoenix fractal.
Videos
Two videos showing different aspects of the Phoenix fractal were published in 2008.
Phoenix Demos I 3:06 minutes, 10.4 MB MP4 320x240
A montage of seven 10-20 second demo clips of parameter iterations of the Phoenix fractal, followed by a short slide show of a few still images.
Phoenix Demos II 1:01 minutes, 3.0 MB MP4 640x480
Two zooms into a weird area of the Phoenix fractal. The second one might make you dizzy...
The Map
The function underlying these images is xn+1 = xn2 + p + q xn-1. This is the Henon map, constructed by Michel Henon in 1976 as part of his work on the Lorenz equations. The sequence of points that result from iterating this function infinitely are known as the Henon attractor. The Henon attractor is a fractal that is a Cantor set in one direction (a nowhere-dense set of disconnected points, sometimes called a "dust") and a continuum in the other. Its fractal dimension is 1.26, so it can be thought of as a bit more than a point, about one quarter of the way toward being a line. It resembles a boomerang when plotted in the complex number plane.
Fractal Art Applications
The Henon map (or "Phoenix" equation, as it is commonly known to fractal artists) is usually rendered for fractal art as a Julia set. That means the parameters p and q are kept constant over the whole image, and the initial value for x is varied depending on the point in the image plane.
As with all Julia sets, depending on the parameters (the values chosen for p and q) the Julia set can be a dust or can have areas that are dense sets.
Most of the images below are dust-like, with one exception being my rendering of the original "Phoenix" image by Shigehiro Ushiki.
I have also generated an image of the central area of one plane of the Mandelbrot set of this map. The full Mandelbrot set is made by choosing a set of parameters (p and q) based on the coordinates on the screen, then iterating the function over and over to see if it converges or diverges. The full Mandelbrot set of this map is four-dimensional, and 4-D monitors aren't in production yet, so I've limited this to a 2-D version scanning over the real part of p and q, keeping the imaginary part set to zero. Unfortunately, unlike the quadratic map, the Mandelbrot set for this map does not give a real clue about how the corresponding Julia sets at a particular point will look. Trial and error is the only way to find interesting Henon map images, which is, of course, where all the fun lies.
Historical Background
Originally, Henon only considered real values for p and q. Ushiki expanded this and considered complex values and created an amazing set of 4-D animations back in the '90s, which are still available on his web page at Kyoto University. The map has been extended and generalized somewhat by fractal artists to include different exponents of the xn and xn-1 terms, as well as including an additional regressive term, xn-2, which also introduces another coefficient and another exponent. That's three additional parameters, bringing the total to 10 for the fully generalized, second-order regressive form of the map.
My Images
Click on any of the thumbnails below for a full 1024x768 image. Many of these were rendered with 25X oversampling, resulting in totally clean, clear, noise-free images.
This is just a tiny sampling of what can be done here, which is why I am so excited.
For the purists, note that it is traditional to render Henon map images rotated 90 degrees so that they are symmetrical left-right as opposed to symmetrical up-down. I have adhered to this tradition but added a small twist because it's easier for my software as it is currently written to put negative numbers at the top, so all images are flipped upside-down from how you might see them elsewhere (although I hope soon to be making images you can't find elsewhere...)
 | Fully zoomed-out view with parameters set to resemble the "western antenna" of the quadratic map. |
 | Zooming in a little bit (10X) to the structure at the top. |
 | A little more (about 100X) |
 | And a lot more, to about 1e9 magnification. |
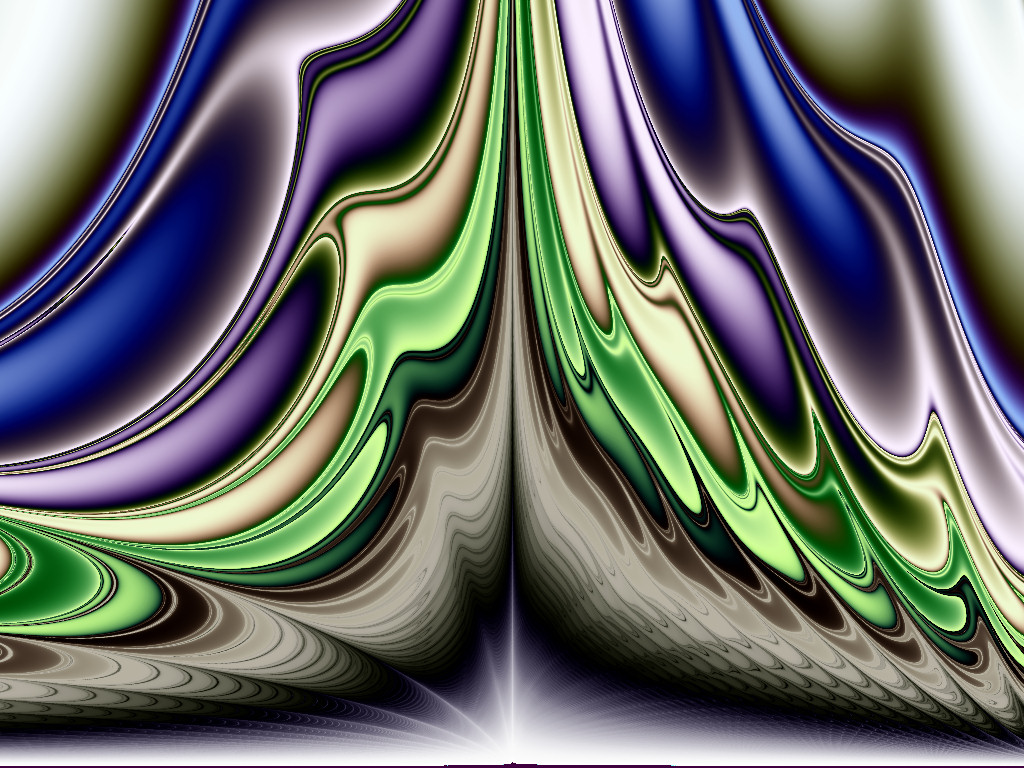
 | Another image fully zoomed out, with a different set of parameters yielding a totally different look. The colors, of course, are arbitrary, but you can see the structure is quite different than the first image above. |
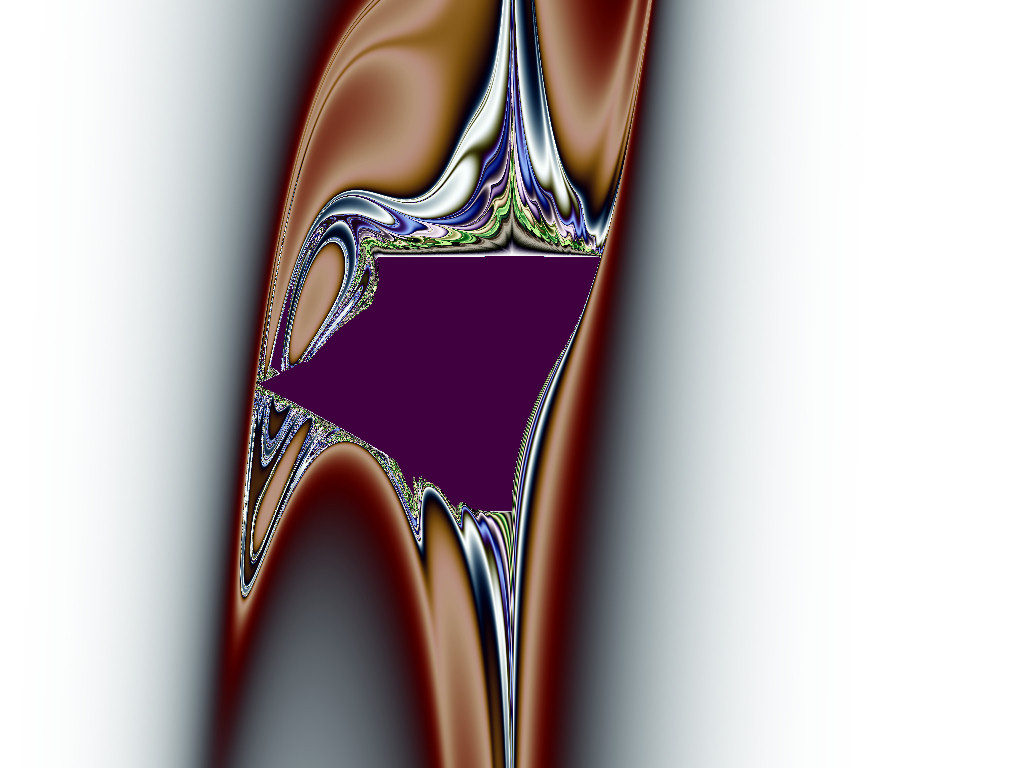
 | This is my upside-down rendering of the original depiction of the Julia set of this map, which was titled "Phoenix" by Shigehiro Ushiki. Although Ushiki was by no means the first to consider this map and its behavior, he was, as far as I can tell, the first to publish this Julia set with these parameters. |
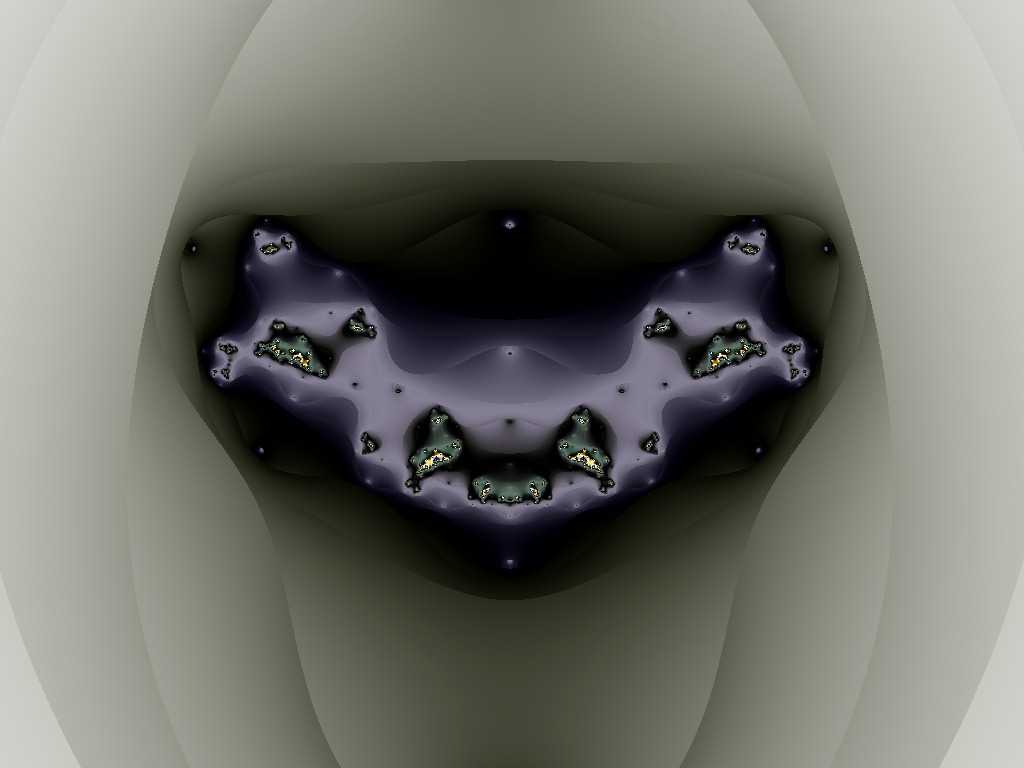
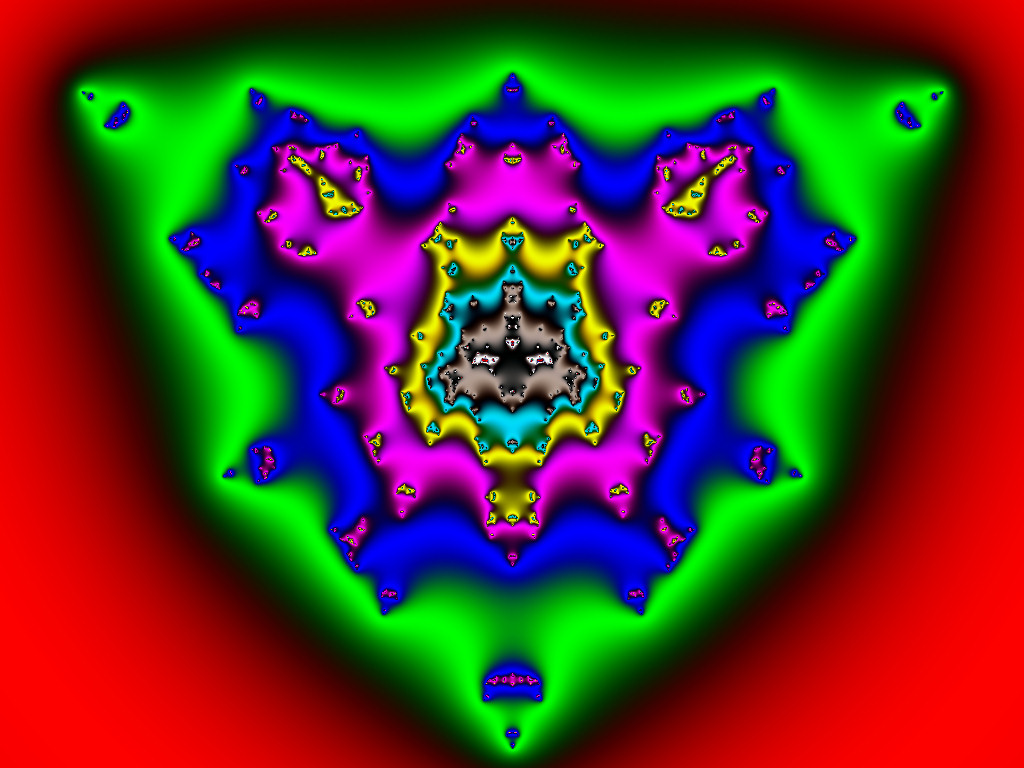
 | The Mandelbrot set for the Henon map. This is a rather ugly duckling with some really pretty feathers. This image has a size of 6 vertically in the complex plane (i.e. the vertical direction extends from -3i to +3i). |
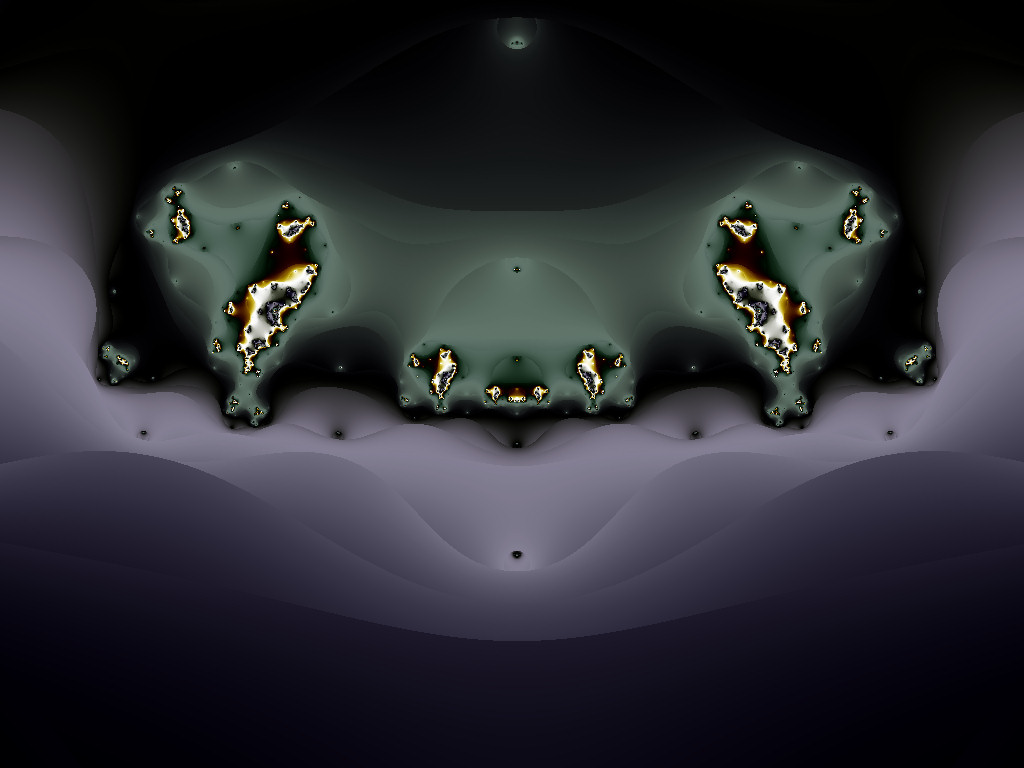
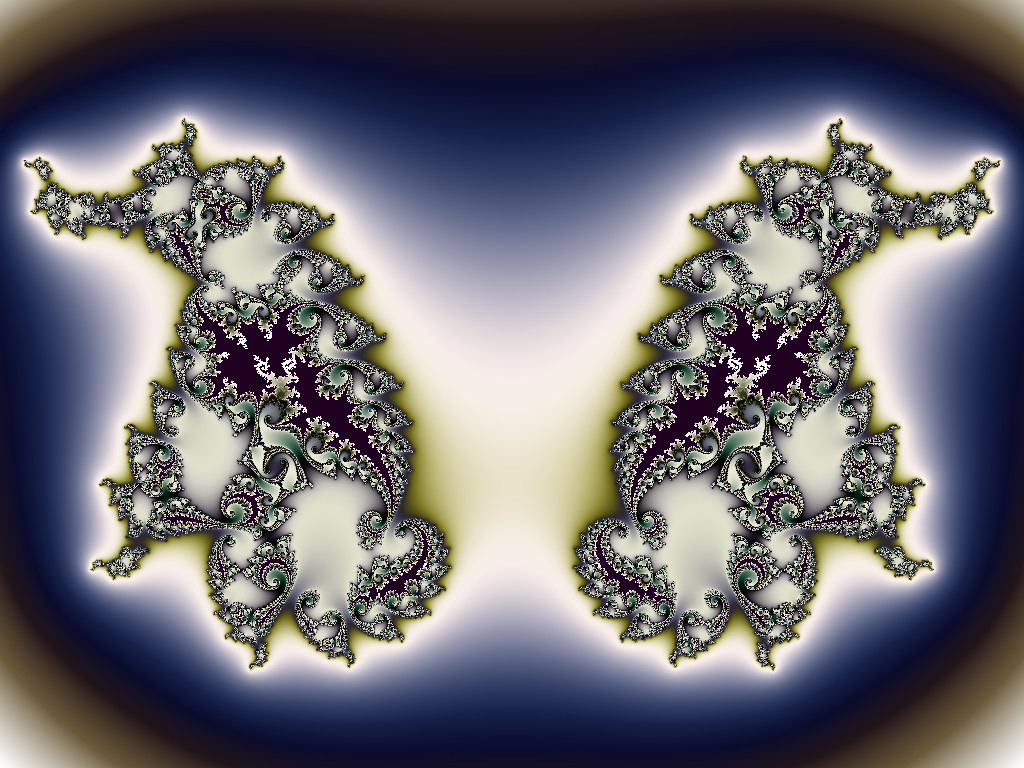
 | This is a 10X magnification of the top part (well, really the bottom part, see above) of the Mandelbrot set of the Henon map. You can kind of see the boomerang shapes of the Henon attractor. |
All content Copyright by Michael Condron. All rights reserved unless otherwise noted.
You may download, save, and print a single copy for personal use only.
Music by various sources used with permission.
Please refer to individual video file credits for details.
