hpdz.net
High-Precision Deep Zoom
Animations
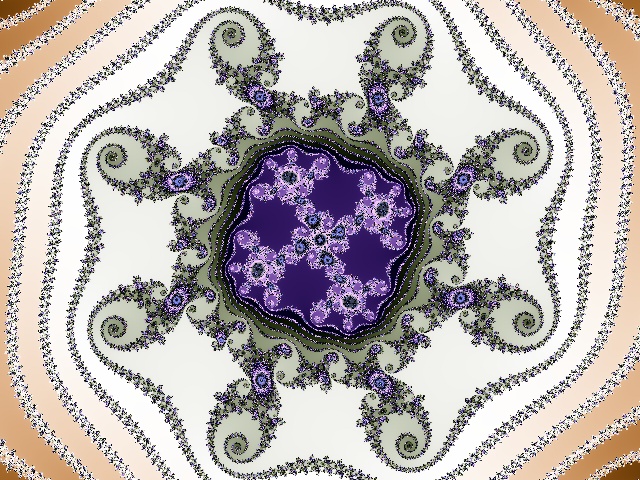
Canyon2
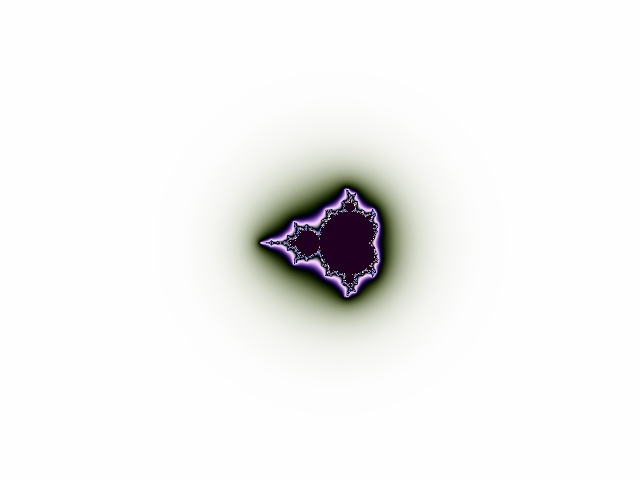
The second in a series of zooms into the Seahorse Valley, also known as the Canyon.
This animation, which zooms into the eastern wall of the canyon, is the sister to Canyon1, which zooms into the western wall. Both use essentially the same colorizing scheme. Canyon2 zooms somewhat more deeply, to about 2e-50, compared to Canyon1, which went to 4e-41.
Canyon2 took nearly 600 hours (25 days) of continuous computation on my quad-core Core2 system, which is the longest rendering time of any animation I have produced so far.
CanyonDeep1, produced in Feb 2009 (several months after this project), explores the little crevice to a modest depth of about 5e-20. That project turned out to be too difficult and it kind of got abandoned.
 |  |  |  |  |
 |  |  |  |  |
| MP4 Files | |
|---|---|
| Fast download | 320x240 6.3 MB 200 Kbps Fast Start |
| Medium Quality | 640x480 64 MB 2 Mbps Fast Start |
| High Quality | 640x480 186 MB 7 Mbps |
| WMV Files | |
| Fast download | 320x240 6.0 MB 200 Kbps |
All these files use variable bit rate encoding to minimize the file size for a particular quality level.
| Dates Generated: | 4-29 Oct 08 |
| Final Image Size: | 1.96e-50 |
| Resolution: | 640x480 |
| Video Length: | 2:40 of fractal, 3:36 total |
| Frames: | 4800 |
| Rendering Time: | 598 hours |
| Method: | Escape counts Adaptive color optimization |
| Audio: | Cinescore |
Comments
Rafael Bombelli
This animation is named in honor of Rafael Bombelli (1526-1572), the Italian mathematician who helped established the validity of what we now call "imaginary" numbers after the works of Tartaglia and Cardano brought them to attention in their equation for the solution of cubic polynomials. Bombelli was the first to embrace the concept of the square root of negative numbers and work out a system of arithmetic for them.
At the time, this was quite profound, since only positive numbers were widely accepted as valid. Even plain old negative numbers were considered somewhat dubious, and certainly taking their square roots made no sense to the mathematicians of the time. Nevertheless, Tartaglia and Cardano had known for some time that finding the solutions to cubic equations frequently demanded writing down the square root of negative numbers. They usually would appear in products like (2+√-1)(2-√-1), where they cancel out and give a final answer 2-(-1) = 3. The final result of that product can be determined just by working with √-1 as an abstract symbol, without considering what the true nature of √-1 is or whether it has a meaning in its own right.
Bombelli further developed arithmetic for the square roots of negative numbers, mainly still within the context of solving cubic equations. For example, he is best known for proving relationships like:
(2+√-121)1/3 + (2+√-121)1/3 = 4
The foundational work by Tartaglia, Cardano, and Bombelli led to Euler, nearly two hundred years later, discovering the deep significance of imaginary numbers in mathematics. Indeed, much of applied mathematics and theoretical physics uses imaginary numbers extensively.
The Mandelbrot set lives in the two-dimensional space of complex numbers, so all fractal animators and artists are deeply indebted to those who developed the theory of complex numbers. Without our awareness of these beautiful monsters, humanity would have no realization of the Mandelbrot set.
Leopold Kronecker (for whom the famous delta symbol was named) said
God invented the integers; all else is the work of Man.
I don't know...I'm not sure Man is clever enough to come up with imaginary numbers. Given the deep role they play in quantum mechanics and relativity, maybe God invented imaginary numbers too.
Production
This video has taken an extraordinary effort to get through final production.
The rendering time was about 50% longer than anything I've done before, and that was just the beginning. This animation is very difficult to color properly -- much more so than Canyon1 -- and after trying nearly a hundred different variations, I am still not satisfied with how it looks. I have settled on this final version with some reservations.
This area of the boundary of the Mandelbrot set, which I got a taste of in Canyon1, yields animations that have huge swings in the range of fractal data that has to be converted to colors, and I have not found a satisfactory way to do this yet. This forces a choice between two unpleasant alternatives:
- Keep the color palette fixed, which gives ugly stretches of time in the video where nearly the whole image is one solid color
- Vary the color palette as the range of the data changes, which keeps the colors nicely distributed in any one frame, but forces the color palette to change over the course of the animation -- similar to an effect referred to as "rolling", which I really don't like.
For this animation I have chosen (2), varying the color palette, mainly because that's the way Canyon1 was done, and I wanted to keep that same theme. I also think it allows you to see more detail in the fractal. Unfortunately, the color rolling is distracting. I think I've done a decent job minimizing the rolling effect, since it ends up being pretty slow, and there are no abrupt shifts in color despite the fact that there are abrupt shifts in the underlying data. The penalty I've paid for this is that there is instead one long, gradual shift. There is no free lunch.
Histogram Animation
To illustrate the point, I've made a short animation of the histogram of the count data for this animation. This was made with Mathematica (external link) using the raw fractal data. The horizontal axis is the bin number, ranging from 1 to 500. Bin 500 corresponds to the maximum escape count that was used, which was 100,000, so each bin represents a count range of 200. The vertical axis is the log (base 10) of the number of pixels in the image that fall into each bin, not counting, of course, pixels that are in the interior of the set. You can see that the peak of fractal data usually has a width of about 20 bins, but it fluctuates considerably, up to 500 bins, as mini-brots move in and out of the video field.
27Nov08: Fixed glitch in rendering of the histogram animation that caused weird shift of the left side of the image.
All content Copyright by Michael Condron. All rights reserved unless otherwise noted.
You may download, save, and print a single copy for personal use only.
Music by various sources used with permission.
Please refer to individual video file credits for details.
